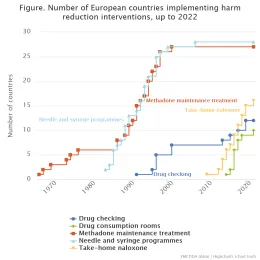
Infographic. Number of European countries implementing harm reduction interventions, up to 2022

Description


Implementation at any level, including pilot projects, is included.

Source data

The data used to generate infographics and charts on this page may be found below.

List of tables

Table 1. Number of European countries implementing harm reduction interventions, up to 2022
Year Drug checking Drug consumption rooms Methadone maintenance treatment Needle and syringe programmes Take-home naloxone
1967     1    
1968     2    
1969          
1970     3    
1971          
1972          
1973          
1974     4    
1975     5    
1976          
1977     6    
1978          
1979          
1980          
1981          
1982          
1983          
1984       2  
1985       3  
1986       6  
1987     8 7  
1988       8  
1989     9 11  
1990     11 13  
1991     12    
1992 1   15 14  
1993     16 16  
1994     17 19  
1995     20 21  
1996 2   22    
1997 5   23 25  
1998     26 26  
1999          
2000       27  
2001 7   27    
2002          
2003          
2004          
2005          
2006          
2007       28  
2008          
2009          
2010         1
2011          
2012          
2013         2
2014 8       4
2015   1     6
2016 9 2     7
2017   6     9
2018 10 8     11
2019   9     13
2020 12       15
2021          
2022 12 10 27 28 16
Table 2. Availability of take-home naloxone in Europe
Country Availability
Austria Available
Belgium Not available
Bulgaria Not available
Croatia Not available
Cyprus Available
Czechia Available
Denmark Available
Estonia Available
Finland Not available
France Available
Germany Available
Greece Not available
Hungary Not available
Ireland Available
Italy Available
Latvia Not available
Lithuania Available
Luxembourg Not available
Malta Not available
Netherlands Not available
Norway Available
Poland Not available
Portugal Available
Romania Not available
Slovakia Not available
Slovenia Available
Spain Available
Sweden Available
Türkiye Not available
Table 3. Needle and syringe distribution and opioid agonist treatment coverage in relation to WHO 2020 targets, 2021 or latest available estimate
Country Proportion in opioid agonist treatment Syringes per person who injects drugs Number people who inject drugs
Croatia 0.5 43 6344
Cyprus 0.17 8 627
Czechia 0.59 232 40500
Finland 0.18 264 25000
France 0.78 118 106857
Greece 0.85 234 2462
Italy 0.27 5 105652
Latvia 0.1 145 7715
Lithuania 0.15 30 8868
Luxembourg 0.86 523 822
Norway 0.86 482 7878
Portugal 0.64 86 13162
Spain 0.9 181 8582
Belgium 0.72 172 7018
Table 4. Location and number of drug consumption facilities throughout Europe
City Country lat lon Number of facilities
Brussels Belgium 50.84 4.35 1
Liege Belgium 50.6278 5.57459 1
Aarhus Denmark 56.14597 10.19845 1
Copenhagen Denmark 55.67453 12.5677 2
Odense Denmark 55.39509 10.38202 1
Vejle Denmark 55.70232 9.522832 1
Paris France 48.8539 2.34879 1
Strasbourg France 48.579 7.73633 1
Berlin Germany 52.504671 13.3945135 3
Bielefeld Germany 52.02656 8.540516 1
Bochum Germany 51.4815 7.2244 1
Bonn Germany 50.78 7.1778 1
Dortmund Germany 51.56247 7.45377 1
Düsseldorf Germany 51.2397 6.6778 1
Essen Germany 51.4798 7.0569 1
Frankfurt Germany 50.20948 8.76 4
Hamburg Germany 53.56828 9.999227 5
Hannover Germany 52.37608 9.73263 1
Karlsruhe Germany 49.012 8.390306 1
Köln Germany 50.93167 6.949464 1
Münster Germany 51.95222 7.623233 1
Saarbrücken Germany 49.24041 6.98665 1
Troisdorf Germany 50.818 7.14125 1
Wuppertal Germany 51.24225 7.158186 1
Athens Greece 38 23.7 1
Esch-sur-Alzette Luxembourg 49.50245 5.97222 1
Luxembourg Luxembourg 49.6503 6.2512 1
Almere Netherlands 52.3829 5.2887 1
Amsterdam Netherlands 52.414 4.90793 3
Apeldoorn Netherlands 52.1813 6.00827 1
Arnhem Netherlands 51.98497 5.899034 1
Deventer Netherlands 52.29638 6.178408 1
Enschede Netherlands 52.1988 6.87604 1
Haarlem Netherlands 52.389 4.6896 1
Heerlen Netherlands 50.8888 5.9811 1
Leeuwarden Netherlands 53.1987 5.8322 1
Leiden Netherlands 52.1597 4.4811544 1
Maastricht Netherlands 50.8541 5.69063 1
Nijmegen Netherlands 51.81272 5.842056 2
Roermond Netherlands 51.2248 5.9753 1
Rotterdam Netherlands 51.8882 4.6136 4
s-Hertogenbosch Netherlands 51.69714 5.305474 1
Tilburg Netherlands 51.60593 5.14963 1
Utrecht Netherlands 52.086 5.1127 1
Vlissingen Netherlands 51.42818 3.52915 1
Zwolle Netherlands 52.54429 6.09052 1
Bergen Norway 60.3954 5.33062 1
Oslo Norway 59.920979 10.753526 1
Porto Portugal 41.149 -8.610 1
Lisbon Portugal 38.716311 -9.142432 2
Badalona Spain 41.450142 2.24742 1
Barcelona Spain 41.3825 2.1769 9
Bilbao Spain 43.2569 -2.9236 1
Lleida Spain 41.61898 0.6201 1
Reus Spain 41.14994 1.10571 2
Sant Adrià de Besòs Spain 41.430599 2.21824 1
Tarragona Spain 41.1186 1.24047 1
Top